




















 Saudi Arabia
 UAE
UAE Qatar
Qatar Bahrain
 Kuwait
 Oman
Oman Lebanon
 Egypt
Egypt India
India UK
UK Ireland
 Germany
 USA
USA Australia
 Singapore
 South Africa
 Iraq
Iraq Jordan
 Hungary
 Georgia
 Turkey
 LagosNigeria




 KPI dashboards · UAE
Dynamics 365 Dashboard Development in the UAE
Dynamics 365 dashboard development in the UAE gives each role a working screen of live figures and to-dos: role centres in Business Central for finance and warehouse users, Dataverse dashboards for sales and service managers, and embedded Power BI tiles where visuals help. Shyphan, an independent Dynamics 365 consultancy, designs dashboards around decisions and keeps them quick to load.
Prefer to talk? Call +971 55 145 3265
Book a free Dynamics 365 consultation
Tell us what you want to fix. A senior consultant replies within one working day with a written view.
Trusted by businesses across the UAE, Saudi Arabia and beyond











Dynamics 365 Dashboard Development in the UAE: the short answer
- What it is
- Dynamics 365 dashboard development is designing role-specific screens of key figures, lists and charts inside Dynamics 365, with drill-down to the records behind each number.
- Best suited to
- UAE managers and teams who open Dynamics 365 every day but still ask colleagues for numbers or build their own spreadsheets to track work.
- Core stack
- Business Central role centres, Dataverse dashboards, Interactive dashboards, Power BI embedded, AL page extensions, Charts and views
- Typical timeline
- Six to ten weeks for Dynamics 365 Sales or Customer Service; ten to sixteen weeks for a single-entity Business Central rollout.
- What it costs
- Licences at Microsoft list price (Sales Professional USD 65, Business Central Essentials USD 70 per user per month). Implementation typically USD 8,000 to 25,000 for Sales or Customer Service and USD 20,000 to 60,000 for Business Central, quoted fixed in AED.
- Local specifics
- UAE week and VAT periods; Mobile access for managers; Arabic captions.
- Delivered by
- Shyphan AI Solutions, an independent Dynamics 365 implementation and integration consultancy that also implements Zoho and Odoo, so recommendations are made by fit.
- Last reviewed
- 29 September 2026
Dynamics 365 Dashboard Development in the UAE: who it is for
UAE managers and teams who open Dynamics 365 every day but still ask colleagues for numbers or build their own spreadsheets to track work. Dynamics 365 dashboard development is designing role-specific screens of key figures, lists and charts inside Dynamics 365, with drill-down to the records behind each number.
- Finance manager role centre
- Sales pipeline dashboard
- Service interactive dashboard
- Warehouse and purchasing cues
What we use to deliver Dynamics 365 dashboard development
Only what the first phase needs is switched on; more follows in later phases.
 Business Central role centres
 Dataverse dashboards
Dynamics 365 Dashboard Development in the UAE: what is included
Dynamics 365 dashboard development in the UAE gives each role a working screen of live figures and to-dos: role centres in Business Central for finance and warehouse users, Dataverse dashboards for sales and service managers, and embedded Power BI tiles where visuals help.
Finance manager role centre
Cues show unposted bank lines, invoices awaiting approval, overdue receivables and VAT payable estimate for the period, each clickable to the list behind it, forming the finance manager's daily checklist.
Sales pipeline dashboard
Dataverse dashboards show pipeline by stage, won against target per salesperson, forecast for the quarter and stalled deals, filtered by territory for UAE and wider GCC sales teams. Targets are maintained by sales managers.
Service interactive dashboard
Customer Service agents and supervisors see queues, SLA risk, cases by priority and channel, and can act directly from interactive stream views without opening separate screens. Supervisors can reassign cases in bulk.
Warehouse and purchasing cues
Warehouse leads see picks due, receipts expected and negative stock, while buyers see items below reorder point and late purchase orders, built as AL cue extensions in Business Central. Thresholds are editable by admins.
Embedded Power BI tiles
Where a trend or comparison is clearer as a chart, Power BI tiles are embedded in role centres or Dataverse dashboards, respecting the user's security so they only see permitted data.
Designed for speed
Cues use efficient queries and FlowFields, and Power BI tiles use scheduled refresh rather than live heavy queries, so dashboards load quickly as data grows. Load times are checked before rollout with production-like volumes.
See it in Dynamics 365
Real screens from the platforms we implement. Yours are configured to your entities, processes and KPIs.
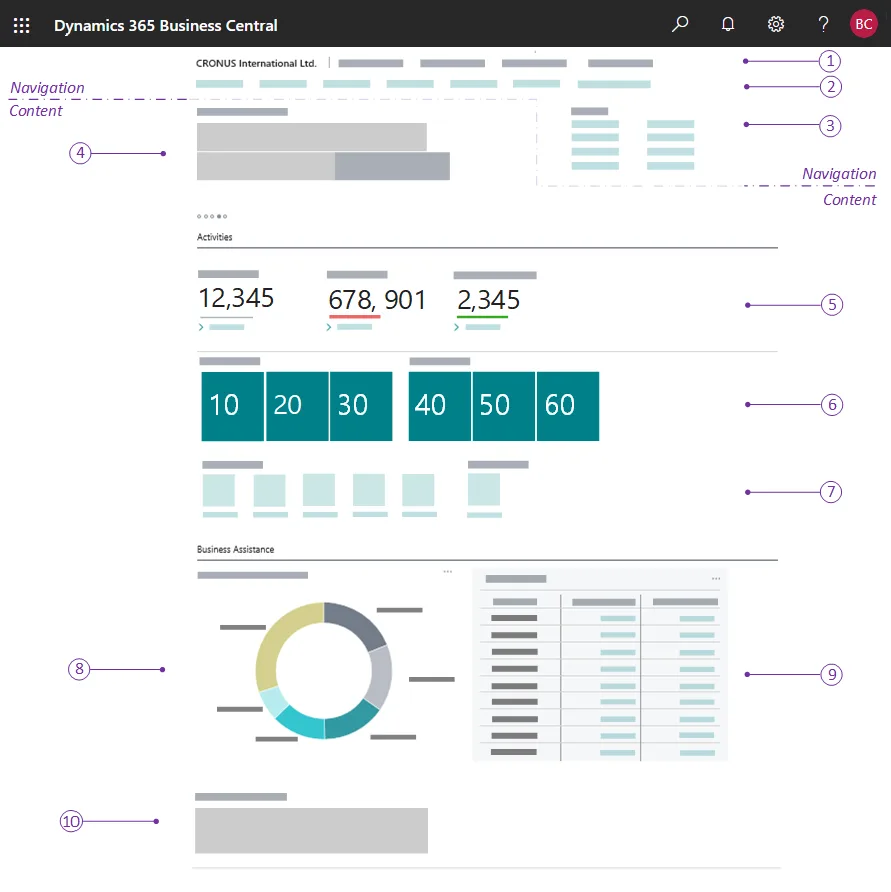
A Business Central role centre
The home page each user gets for their role: headlines, activity cues, KPI tiles, charts and actions. The numbered callouts come from Microsoft's documentation.
- UAE week and VAT periods
- Mobile access for managers
- Arabic captions
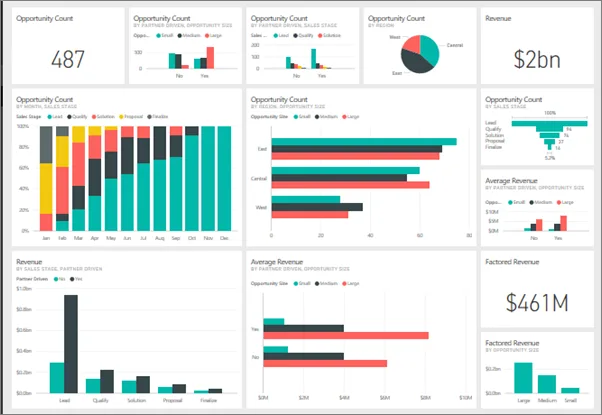
A Power BI dashboard
Pipeline, revenue and opportunity tiles pinned from several reports into one dashboard, the layer we put over Dynamics 365 data.
- Finance manager role centre
- Sales pipeline dashboard
- Service interactive dashboard
What changes in the UAE
The local rules and realities we design for before go-live. Rules change, so we re-check the current position at scoping.
UAE week and VAT periods
Figures use the Monday to Friday UAE working week and your VAT period boundaries, so weekly and period figures match how teams and accountants plan.
Mobile access for managers
Business Central and Dynamics 365 Sales mobile apps display role centres and dashboards, useful for UAE managers who check figures between site visits and meetings.
Arabic captions
Cue captions, chart titles and dashboard labels can be translated to Arabic, so Arabic-speaking users see consistent terms across standard and custom elements. Number formats stay consistent.
How we deliver Dynamics 365 dashboard development
Phases, indicative timing and what is delivered in each. Scope is fixed and priced in AED before we start.
Decision interviews
Interview each role about daily and weekly decisions and the figures that drive them before choosing any chart.
KPI definitions
Write precise definitions for each figure and agree them with finance, so everyone trusts the same numbers.
Prototype
Build a first version in a sandbox and review it with users for layout, missing figures and clutter.
Build and secure
Develop cues, dashboards and Power BI tiles, apply security and test load times with realistic data.
Rollout
Assign role centres and dashboards to users, train managers on drill-down and collect feedback after two weeks.
When Dynamics 365 dashboard development is the wrong answer
A dashboard nobody acts on is decoration. If you cannot name the decision each number supports, leave it off. And for board-level analysis across several systems and years, a dedicated Power BI model is better than crowding operational dashboards. We will help you cut the list down.
How we handle it: We implement Zoho, Odoo and Dynamics 365 and build AI and custom software, so our written recommendation can point you to a simpler option, or to doing nothing yet.
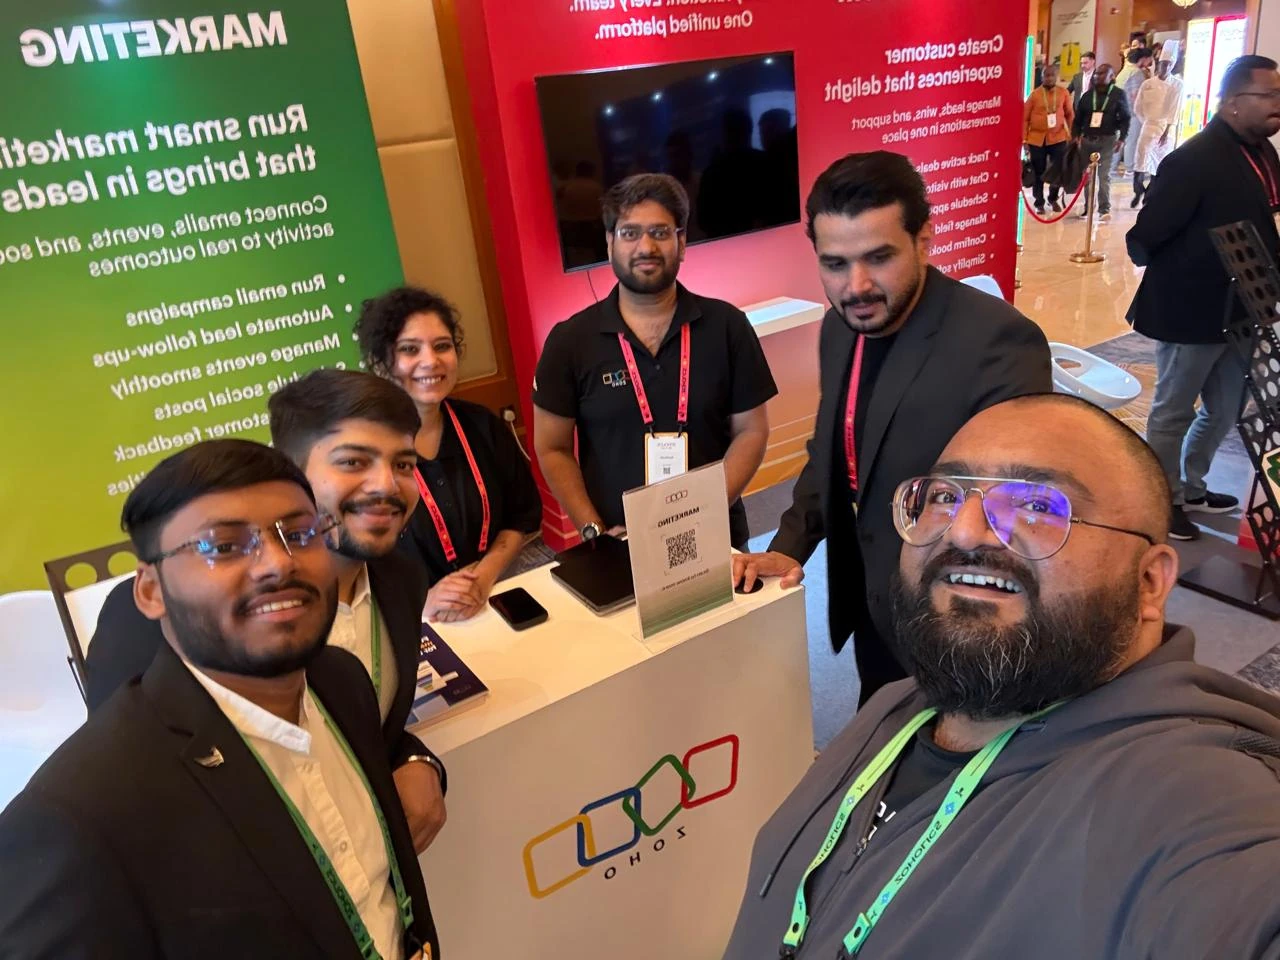
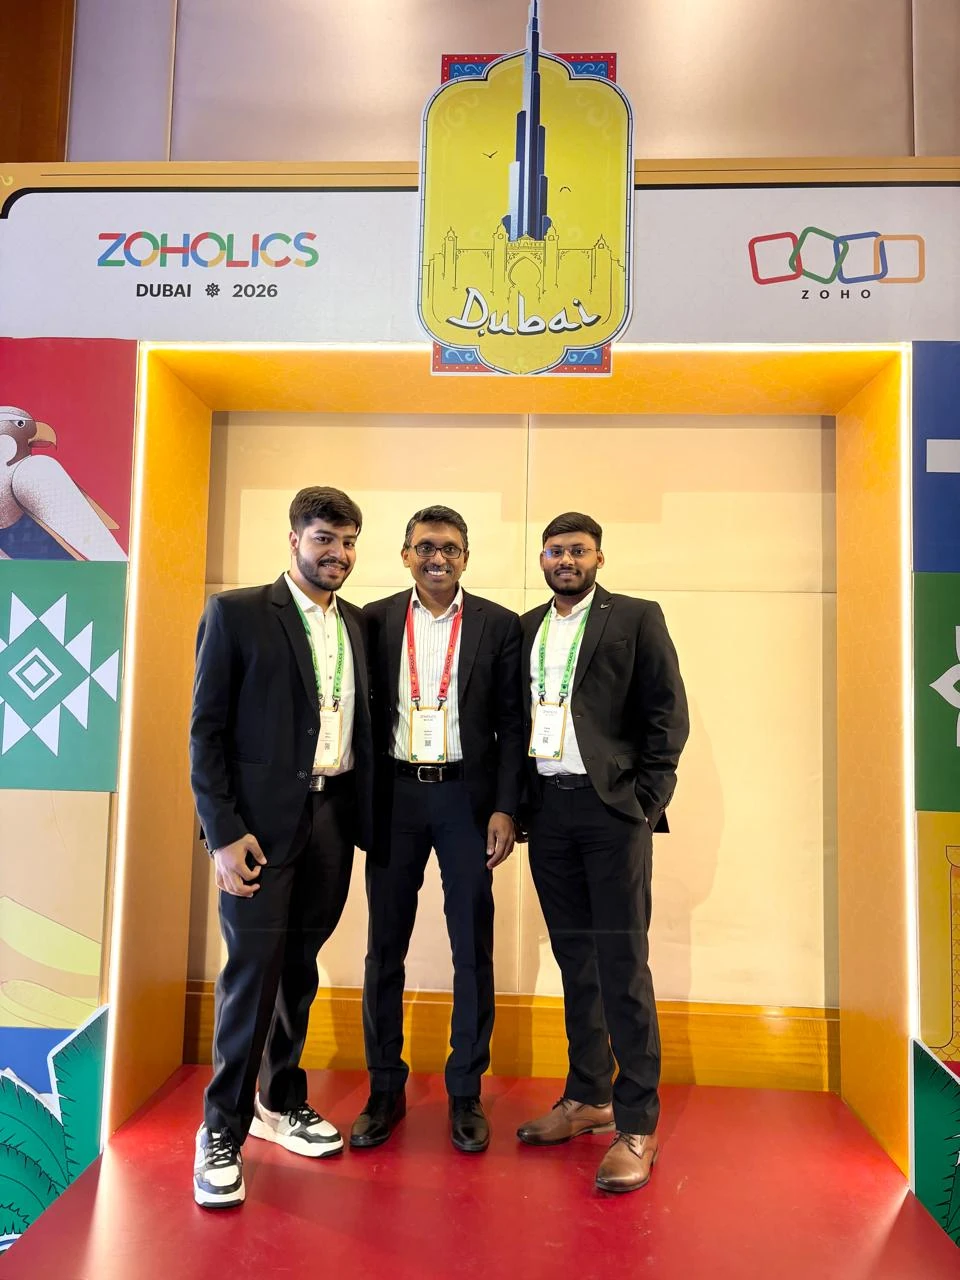
A UAE team you can meet in person
That is our team at Zoholics Dubai 2026. We deliver Dynamics 365 projects from our Ras Al Khaimah office with remote delivery across all seven emirates, in English and Arabic, and we run workshops on site in Dubai, Abu Dhabi and Sharjah when a project needs it.
How this fits the person who owns the problem
Guides for UAE finance, sales, HR, operations, IT and business leaders that use this product. All roles
Dynamics 365 Dashboard Development in the UAE: questions we get asked
What does Dynamics 365 dashboard development in the UAE deliver?
What is a Business Central role centre?
Can Power BI appear inside Dynamics 365?
Do dashboards slow down Dynamics 365?
Can managers view dashboards on phones?
How is dashboard development priced?
Why choose Shyphan?

Talk to a consultant about Dynamics 365 dashboard development
A free 30-minute call, then a written recommendation and a fixed quote in AED, including the honest option that this is not the right fit.