



















 Saudi Arabia
 UAE
UAE Qatar
Qatar Bahrain
 Kuwait
 Oman
Oman Lebanon
 Egypt
Egypt India
India UK
UK Ireland
 Germany
 USA
USA Australia
 Singapore
 South Africa
 Iraq
Iraq Jordan
 Hungary
 Georgia
 Turkey
 LagosNigeria




 Dashboard development · UAE
BI Dashboard Development in the UAE
BI dashboard development UAE teams ask us for is about one thing: a screen a manager can read in 30 seconds and act on. Shyphan designs and builds management dashboards in Power BI, Zoho Analytics, Odoo or as custom web dashboards, with clear visual design, drill-down, mobile layouts and automatic refresh from your systems. Each dashboard set is a fixed quote in AED after a free discovery call.
Prefer to talk? Call +971 55 145 3265
Get a free recommendation
Tell us what you want to fix. A senior consultant replies within one working day with a written view.
Trusted by businesses across the UAE, Saudi Arabia and beyond











BI Dashboard Development in the UAE: the short answer
- What it is
- BI dashboard development is the design and build of interactive visual screens that show key measures, trends and exceptions from business data, refreshed automatically.
- Best suited to
- UAE companies with reasonably clean data in an ERP, CRM or database who want managers to stop reading spreadsheets and start seeing exceptions at a glance.
- Core stack
- Power BI, Zoho Analytics, Odoo Spreadsheet, React, Apache ECharts, Power BI Embedded
- Typical timeline
- Four to sixteen weeks depending on the platform, modules, data migration and integrations; we phase larger programmes.
- What it costs
- A fixed price in AED after a free discovery call, phased so you are never committing to the whole programme on day one. Platform licences are billed by the vendor.
- Local specifics
- Arabic dashboard labels; Views by emirate; UAE calendar built in.
- Delivered by
- Shyphan AI Solutions: Zoho Premium Partner, Official Odoo Partner, independent Dynamics 365 consultancy and custom software house, so the platform is chosen by fit.
- Last reviewed
- 29 September 2026
BI Dashboard Development in the UAE: who it is for
UAE companies with reasonably clean data in an ERP, CRM or database who want managers to stop reading spreadsheets and start seeing exceptions at a glance. BI dashboard development is the design and build of interactive visual screens that show key measures, trends and exceptions from business data, refreshed automatically.
- Designed around decisions
- Data visualization done properly
- Drill-down to the record
- Phone and wall-screen layouts
What we use to deliver BI dashboard development
Tools and platforms we typically use, and the systems it connects to. The final choice is made against your systems, budget and team.





 Odoo
Odoo Business Central
 Microsoft 365
 WhatsApp
BI Dashboard Development in the UAE: what is included
BI dashboard development UAE teams ask us for is about one thing: a screen a manager can read in 30 seconds and act on.
Designed around decisions
Each dashboard starts from the question a manager asks each morning. We sketch the layout on paper with them, put the most important number top left, and remove any chart that does not change a decision. Fewer visuals, read faster.
Data visualization done properly
Chart types match the data: lines for trends, bars for comparisons, tables where exact values matter, and no 3D pies. Consistent colours mean red always signals the same thing across every page, which matters when dashboards are shared across departments.
Drill-down to the record
A manager clicking a weak region drills to branch, salesperson and invoice. The path to the underlying transaction answers the next question on the spot instead of generating an email to finance.
Phone and wall-screen layouts
Separate layouts for phones, laptops and office TV screens, because a sales manager on the road and an operations wall display need very different density. Power BI and Zoho Analytics both support mobile views.
Custom and embedded dashboards
When dashboards must sit inside a customer portal or your own app, we build them in React with a charting library or embed Power BI, with each client seeing only their own data.
Automatic refresh and alerts
Data refreshes on a schedule from ERP, CRM or databases, and alerts fire when a measure crosses a threshold, for example overdue receivables above a limit or stock cover falling below two weeks.
Building materials trader's receivables dashboard
How BI dashboard development in the UAE looks in practice. Illustrative; every project is scoped to the business.
Picture a building materials trader with branches in Dubai, Sharjah, Abu Dhabi and Fujairah selling cement, steel and blocks to contractors on credit. Each branch manager sends a weekly Excel file of sales and overdue balances, formats differ, and the leadership team argues over which figures are right. Collections slip as contractors' payment cycles stretch.
- Connect the ERP's sales, receivables and credit limit data to Power BI directly, replacing branch Excel files with one consistent data model for all four branches.
- Design a leadership page showing overdue balances by ageing bucket, branch and contractor, with drill-down to the invoice level for collection follow-up.
- Add a mobile layout and weekly email subscription for branch managers, plus alerts when a contractor's overdue balance crosses the credit limit set by finance.
See it on the platforms we deliver
Real screens from the platforms we implement. Yours are configured to your entities, processes and KPIs.
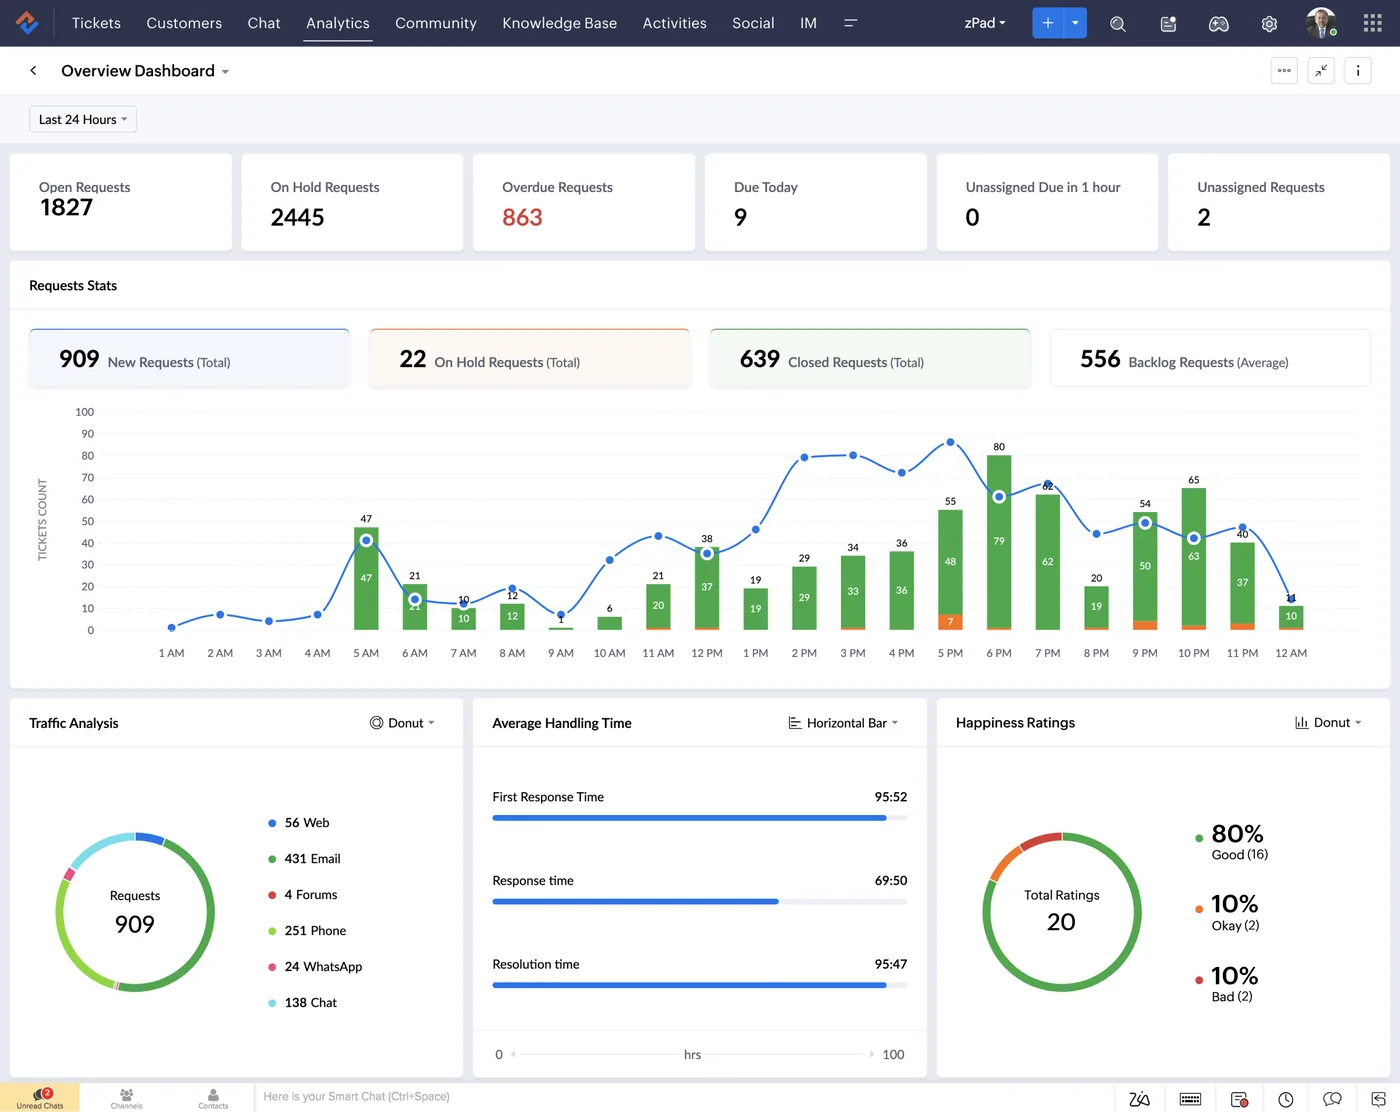
The support overview dashboard in Zoho Desk
Open, on-hold, overdue and unassigned requests, hourly ticket volume, traffic by channel, average handling times and customer happiness ratings.
- Designed around decisions
- Data visualization done properly
- Drill-down to the record
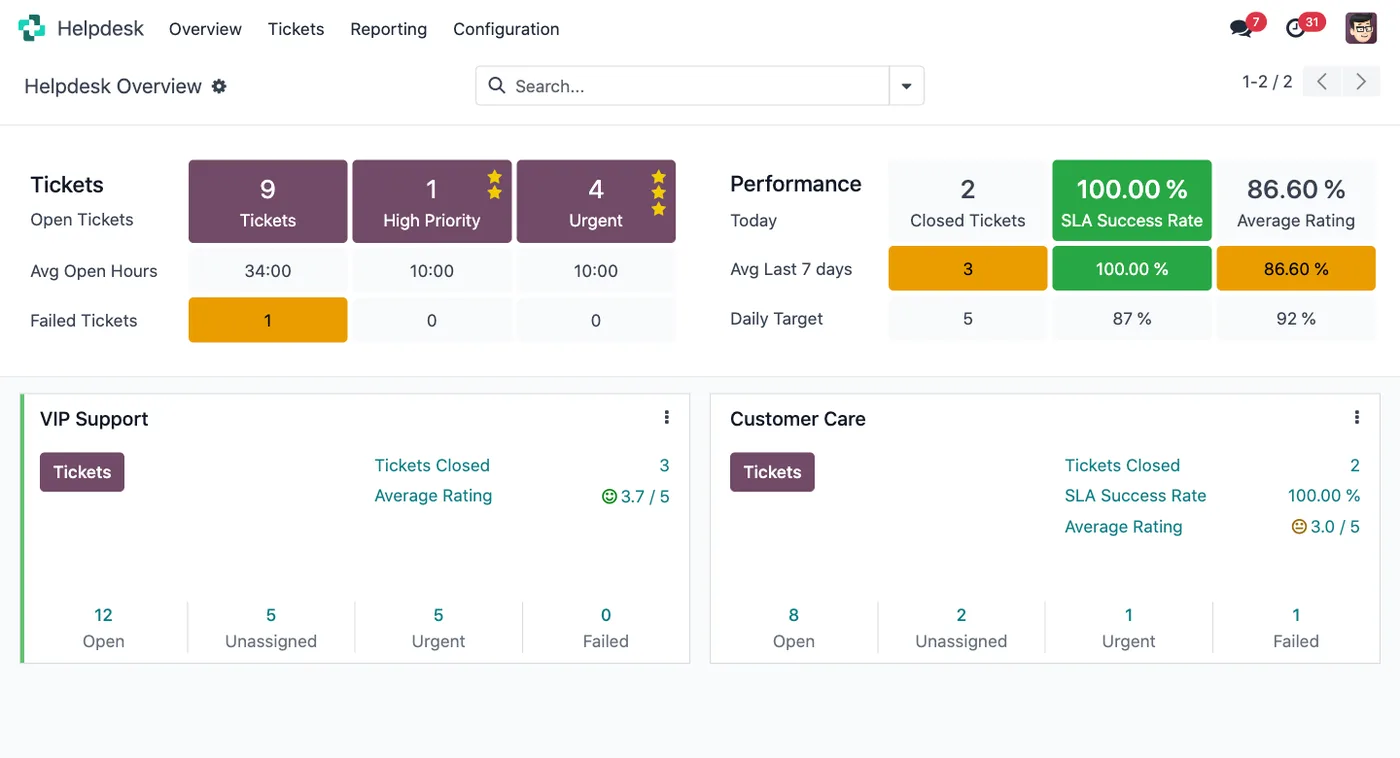
The Odoo Helpdesk overview
Open tickets, high-priority and urgent counts, SLA success rate and ratings per team.
- Phone and wall-screen layouts
- Arabic dashboard labels
- Views by emirate
Which platform for BI dashboard development in the UAE?
An honest comparison. We implement all of these, so the recommendation follows your processes, team and budget.
| Option | Best when | How it fits this need |
|---|---|---|
| Power BI | Microsoft 365 estate, several data sources, broad sharing | A strong choice for UAE groups with multiple branches or entities, especially where leadership already works in Microsoft 365 and Teams and wants dashboards on phones. |
| Zoho Analytics | Zoho Books and CRM hold most of the data | Cost-effective with native Zoho connectors and quick setup. Suitable for most receivables and sales dashboards in Zoho-based businesses, with fewer modelling options than Power BI. |
| Odoo Spreadsheet dashboards | Odoo is the ERP and needs are moderate | Keeps dashboards inside Odoo with live data and no extra BI licences. Less suited to combining several external data sources or advanced modelling. |
| Excel with Power Query | One analyst, few users, low budget | Honestly fine for a small team with one skilled analyst. Struggles once many managers need consistent, secure, mobile access to the same figures. |
What changes in the UAE
The local rules and realities we design for before go-live. Rules change, so we re-check the current position at scoping.
Arabic dashboard labels
Board members and government-linked clients in the UAE often want Arabic. Dashboards can carry Arabic titles and labels with right-to-left layout on a shared data model, so both versions show identical numbers.
Views by emirate
UAE companies often compare Dubai, Abu Dhabi, Sharjah and the northern emirates. Map and branch visuals group by emirate and by free zone versus mainland, which also helps with VAT treatment checks.
UAE calendar built in
Dashboards use a date table with the UAE weekend, public holidays and Ramadan periods, so daily comparisons and working-day targets are not distorted by calendar differences.
What drives the cost, and what it connects to
No price list: we quote a fixed price in AED after discovery. These are the factors that move the effort up or down.
Entities and branches
Combining several legal entities, branches or emirates needs consistent mapping of customers, products and accounts, which may require cleanup in the source systems first.
Drill-down depth
Summary dashboards are quicker than models supporting drill-down from group totals to individual invoices, which need careful data modelling and performance tuning.
Layouts and audiences
Designing separate desktop, phone and wall-screen layouts for leadership, managers and operations adds design and testing effort for every page that each audience actually uses.
Alerts and subscriptions
Automated alerts, email subscriptions and Teams notifications based on thresholds need configuration and agreed rules on who receives what, when, and what action they should take.
What it connects to
Sales, receivables and credit limits flow to Power BI through standard connectors for group reporting.
Invoices, payments and customer balances refresh on schedule into the dashboard data model.
Pipeline and quotation data join sales results to show conversion by branch and salesperson.
Dashboards are pinned in leadership channels, and threshold alerts post automatically when balances exceed limits.
Approved budgets upload monthly so dashboards compare actual sales and collections against targets by branch.
How we deliver BI dashboard development
Phases, indicative timing and what is delivered in each. Scope is fixed and priced in AED before we start.
Question workshop
We list the questions each audience asks, the measures that answer them and where the data comes from.
Wireframes
Paper or Figma sketches of each page are reviewed with users before any data work, so layout debates happen early and cheaply.
Data connection
Sources are connected, measures written and checked against system totals, with gaps reported rather than hidden.
Build and polish
Dashboards are built, tested on phone and desktop, and refined with users over two short review rounds.
Publish and train
Access roles set, refresh scheduled, users trained in a short session, and a change process agreed for new requests.
When BI dashboard development is the wrong answer
If your data is spread across many systems with no agreed definitions, dashboards will look good but show conflicting numbers. In that case we suggest starting with a wider BI engagement to fix the model first. And if you need two or three simple charts, the built-in dashboards in Zoho, Odoo or Business Central may be enough without a project.
How we handle it: We implement Zoho, Odoo and Dynamics 365 and build AI and custom software, so our written recommendation can point you to a simpler option, or to doing nothing yet.
Checklist and common mistakes
Buyer's checklist
What to ask for before you choose a provider.
- Ask the provider to show how drill-down reaches individual records, not just summary totals, on your own sample data.
- Confirm each metric's definition in writing, such as when an invoice counts as overdue, before building visuals.
- Check how security roles restrict data by branch, entity or emirate, and test them with real user accounts.
- Ask for phone layouts and test them with managers who will mostly view dashboards away from their desks.
- Require refresh monitoring with alerts when a data source fails, so managers never act on stale figures unknowingly.
- Confirm handover includes the data model documentation and training for someone in your team to add reports.
Common mistakes
What we see go wrong in the UAE, and how to avoid it.
- Rebuilding the old spreadsheetCopying branch Excel layouts into a BI tool keeps the confusion. Start from decisions leaders make and design pages around those decisions.
- No single owner for metricsWithout a named owner, each department redefines figures. Assign finance or a named data owner to approve metric definitions and any later changes to them.
- Dashboards nobody opensDashboards without a meeting or routine that uses them fade quickly. Link each page to a weekly review or specific decision process.
- Ignoring Arabic readersSome UAE owners and managers prefer Arabic. Where relevant, provide Arabic labels and right-to-left friendly layouts for the key leadership pages they review.


A UAE team you can meet in person
That is our team at Zoholics Dubai 2026. We deliver Zoho, Odoo, Dynamics 365 and custom projects from our Ras Al Khaimah office with remote delivery across all seven emirates, in English and Arabic, and we run workshops on site in Dubai, Abu Dhabi and Sharjah when a project needs it.
BI Dashboard Development in the UAE: questions we get asked
What does BI dashboard development UAE projects include?
Do you do management dashboard development for leadership teams?
What data visualization tools do you use in the UAE?
How is dashboard development different from a business intelligence company engagement?
How long does it take to build a dashboard?
How much does dashboard development cost?
Can BI dashboards in the UAE combine data from different ERPs across entities?
Can dashboards be shown on office wall screens?
Do we need a data warehouse before building BI dashboards?
Why choose Shyphan?

Talk to a consultant about BI dashboard development
A free 30-minute call, then a written recommendation and a fixed quote in AED, including the honest option that this is not the right fit.